Which tokenstat command shows what

tokenstat scan collects usage counters and metadata into a local archive. Reports read that archive. Setup, vendor fetches, reference refreshes, updates, account sync, and remote-host commands have separate network behavior.
tokenstat scan       # read the logs into the archive
tokenstat            # look at it
Start with the bare command
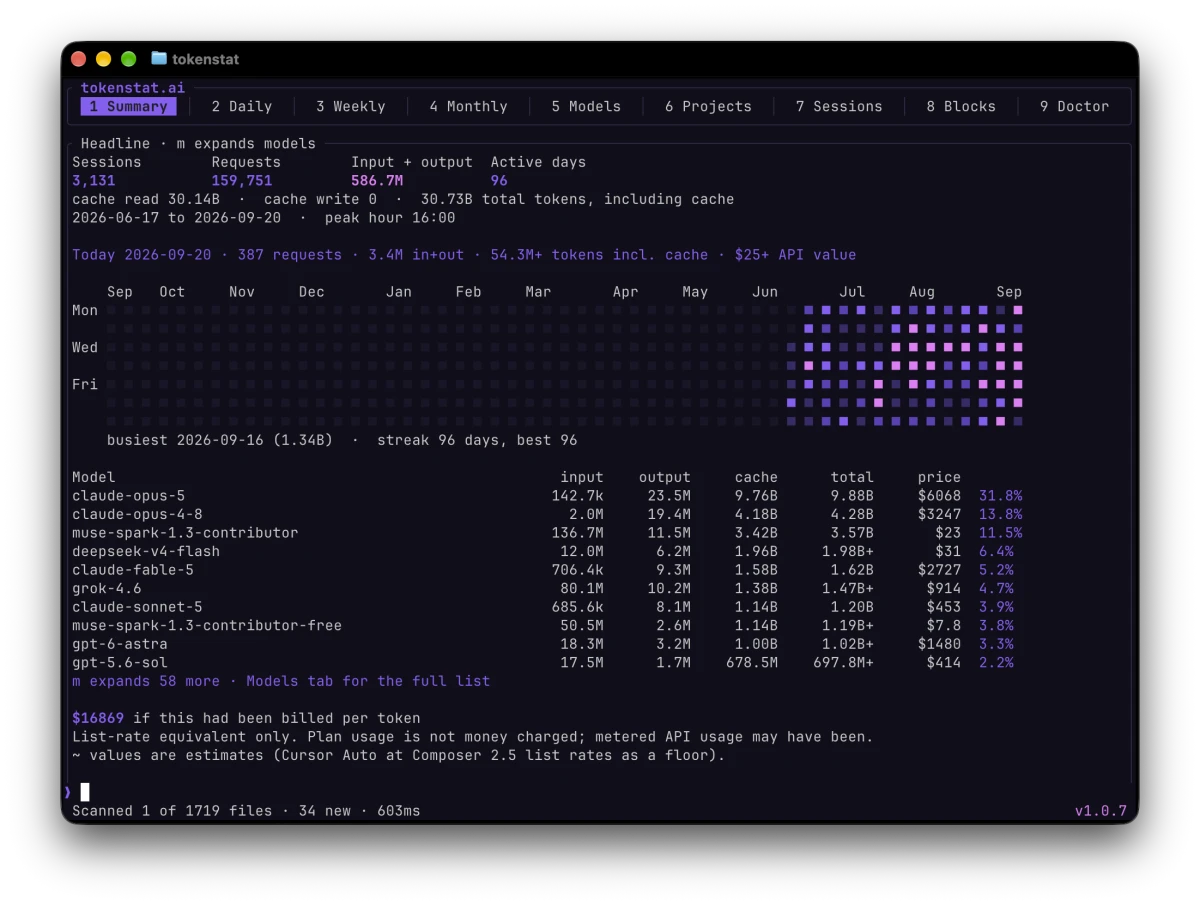
Typed on a terminal with nothing piped, tokenstat opens a full-screen client: tabs, headline numbers, and a command field. If the archive was last scanned more than 10 minutes ago it rescans on open, so you are not reading yesterday's picture by accident.
Pipe it, or run it in a script, and it prints a one-shot report instead. tokenstat summary is that same report on demand.
Pick the shape of the question
| You want to know | Command |
|---|---|
| The headline: totals, activity grid, models | tokenstat summary |
| When you work, as a calendar | tokenstat heatmap |
| A heavy Tuesday | tokenstat daily |
| The trend over weeks or months | tokenstat weekly / tokenstat monthly |
| Which model handled the work | tokenstat models |
| Which repository is absorbing it | tokenstat projects |
| One conversation at a time | tokenstat sessions |
| Load inside a five-hour window | tokenstat blocks |
| The year, told as a story | tokenstat wrapped |
| Is the archive healthy | tokenstat doctor |
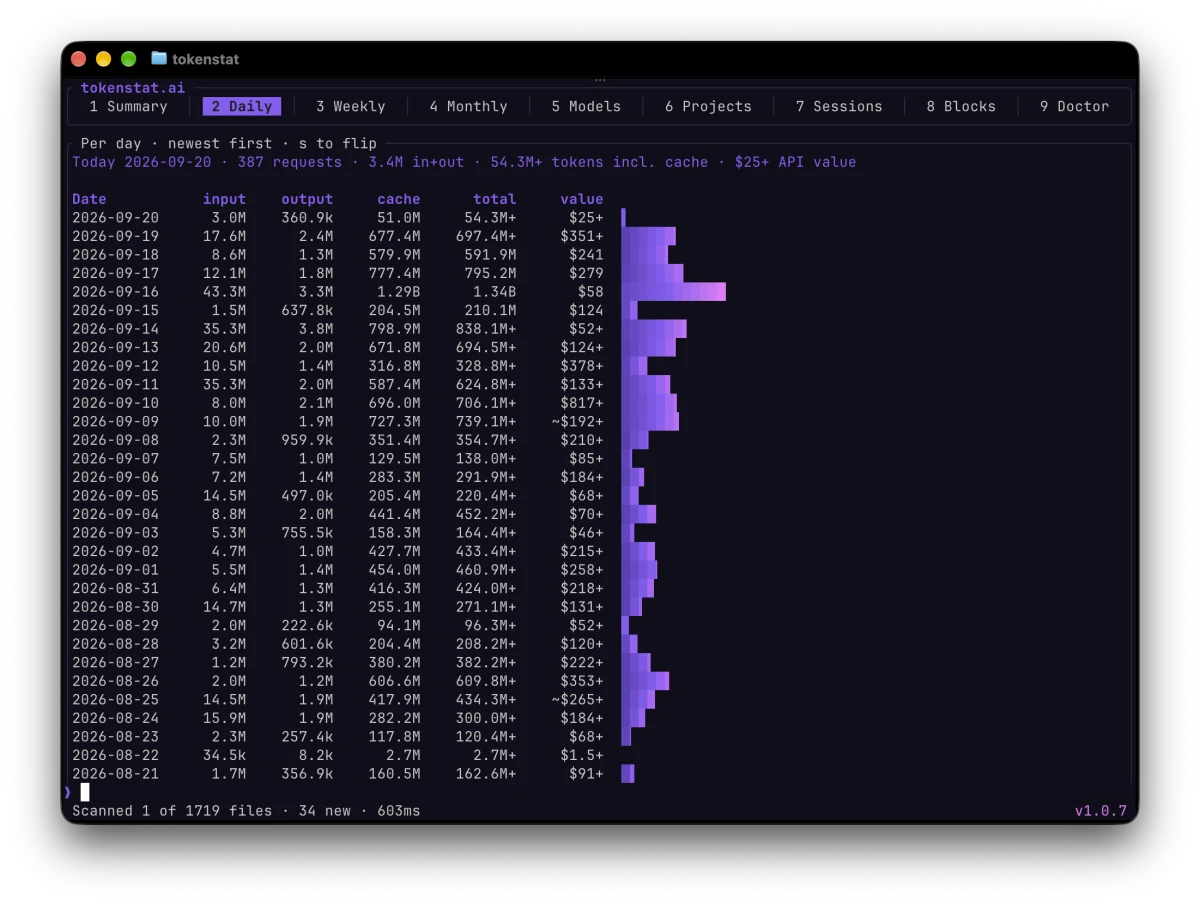
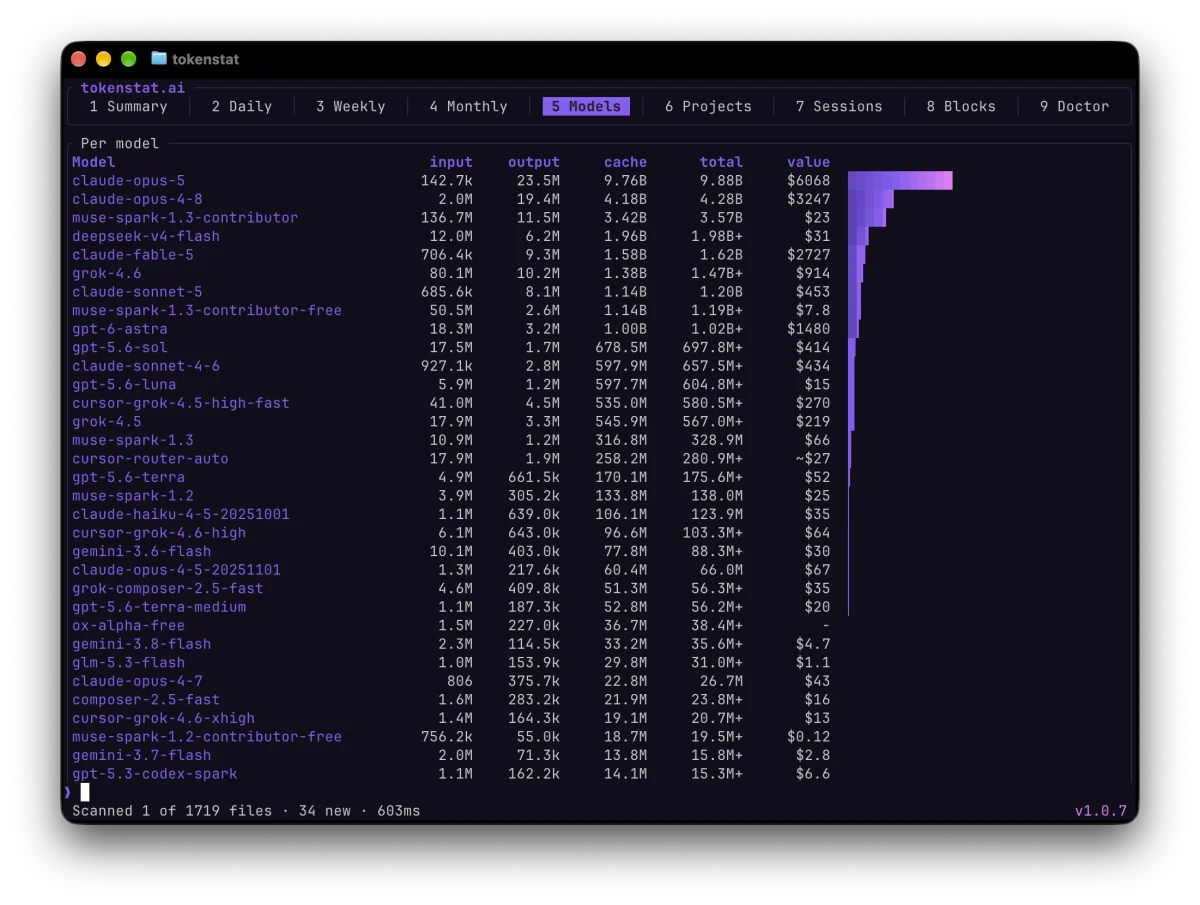
blocks is useful for vendors that meter on rolling multi-hour windows instead of calendar days. A five-hour view shows bursts that a daily total flattens out.
Four filters, every command
Every view takes the same filters, which means you learn them once:
tokenstat models --since 2026-07-01
tokenstat daily --last 14
tokenstat projects --model claude-opus-4-6
tokenstat sessions --project tokenstat
--sinceand--untilbound a date range--last Nis the last N periods that command counts in--modelnarrows to one model--projectnarrows to one repository
They compose. tokenstat daily --last 30 --model claude-opus-4-6 is a month of one model, by day.
Everything speaks JSON
Add --json to any command and you get the machine-readable version of the same report:
tokenstat models --json
The JSON output makes tokenstat scriptable. It also powers the website profile heatmap: tokenstat heatmap has a stable JSON contract.
For a full dump, tokenstat export writes every event as CSV or JSON. tokenstat mcp runs an MCP server over stdio, so a coding agent can query your usage.
Prices are not in the binary
List rates ship as a snapshot you fetch, not as numbers baked into the release:
tokenstat pricing --refresh
Setup fetches the reference snapshots. Run a refresh to update them. Token counts remain available when prices are missing. tokenstat pricing on its own shows what snapshot you currently hold.
Manage collection and a host
tokenstat setup scans, configures scheduled collection and updates, and offers an optional account step. See install options.
tokenstat host shows the always-on service state. It also provides install, start, stop, logs, and device-access commands. See host setup.
Related
- Why cache reads dominate your token count explains what the columns in these reports mean.
- Set a budget and put usage in your prompt covers the two commands designed for quick status checks.
- What tokenstat counts, and where the numbers come from is the source side of the same story.
More in CLI and MCP